An online retailer can trace the whole visit, from the first page a shopper opens to the item they drop into the cart and quietly remove again. A physical store gets far less. Its record begins at the register, with who bought what and for how much, and it says nothing about the shopper who walked a lap of the store and left, or the one who lingered at a shelf and walked away empty-handed.
The cameras in the store have been watching all of this the whole time. The difference between watching and knowing is whether the footage ever becomes numbers.
Count the Arrivals First
Cameras at the entrances run bidirectional people counting and log arrivals by time slot. With anonymized analysis, the same footage can also sketch who those visitors were, by gender and age band. Everything is reported as aggregate ratios, with no individual identified.
Hourly counts give staffing plans a baseline. How many people the anniversary sale drew, or how far a rainy afternoon fell off, used to be a matter of memory. Now it is on record. The same counting applied to the checkout area becomes queue management: when the number of people waiting passes a set threshold, the system sends a notification to open another register.
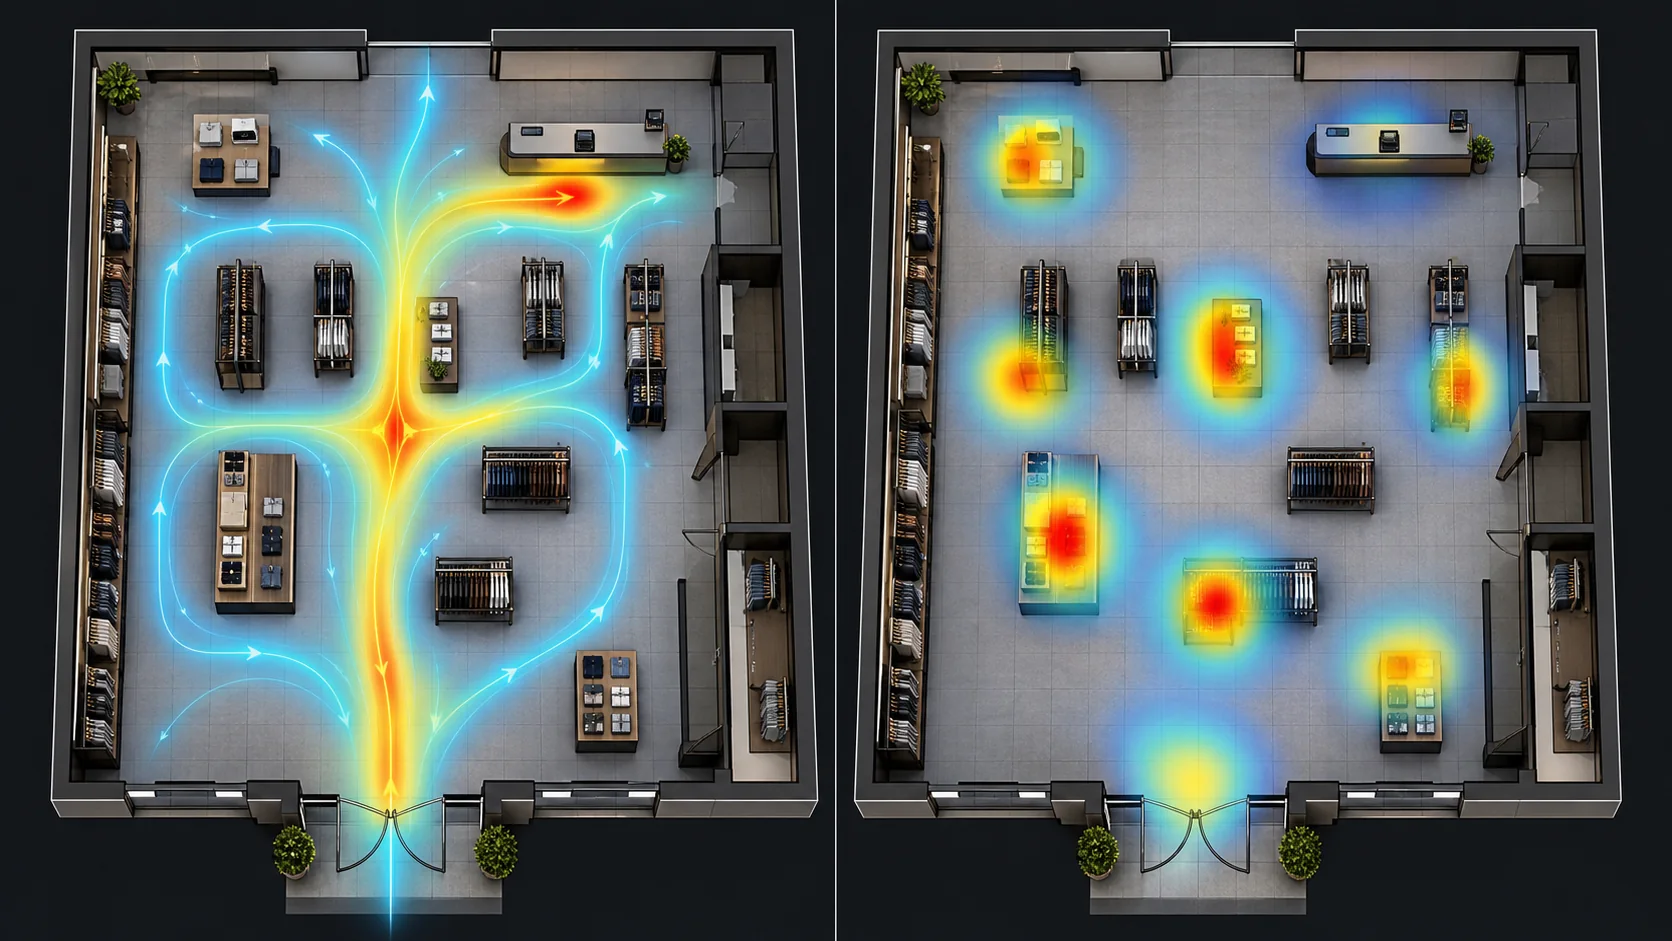
Red means different things in different places on these maps. Along the main aisle it is traffic, people on their way somewhere else. In front of a shelf it is dwell, a shopper who stopped.
Promotional displays are the clearest test. A featured endcap goes out, and the dwell map shows whether anyone actually stops at it. For some slow-selling items the problem turns out to be that shoppers never see them at all, which is a placement problem a price cut will not fix. Cold corners deserve the same reading: either the merchandise there has no pull, or the walking paths never bring people past it. Move an endcap or change the signage, and the effect shows in the following week’s map, without waiting for the month-end sales report.
Matching Foot Traffic to POS
The transaction records were never the problem. It is the stretch before the transaction that stores have lacked, and the counting supplies it. With arrivals as the denominator and transactions as the numerator, a store gets a conversion rate of its own. Zone dwell read against zone sales narrows things further. Where many people stop but few buy, the likely causes come down to display, price range, or whether anyone was free to help at peak hours.
There is one precondition. Traffic and POS data have to be matched by time and by zone, and that happens at the management platform layer rather than inside the camera, so the integration belongs in the deployment plan from the start.
The Back End Collects Video and Events
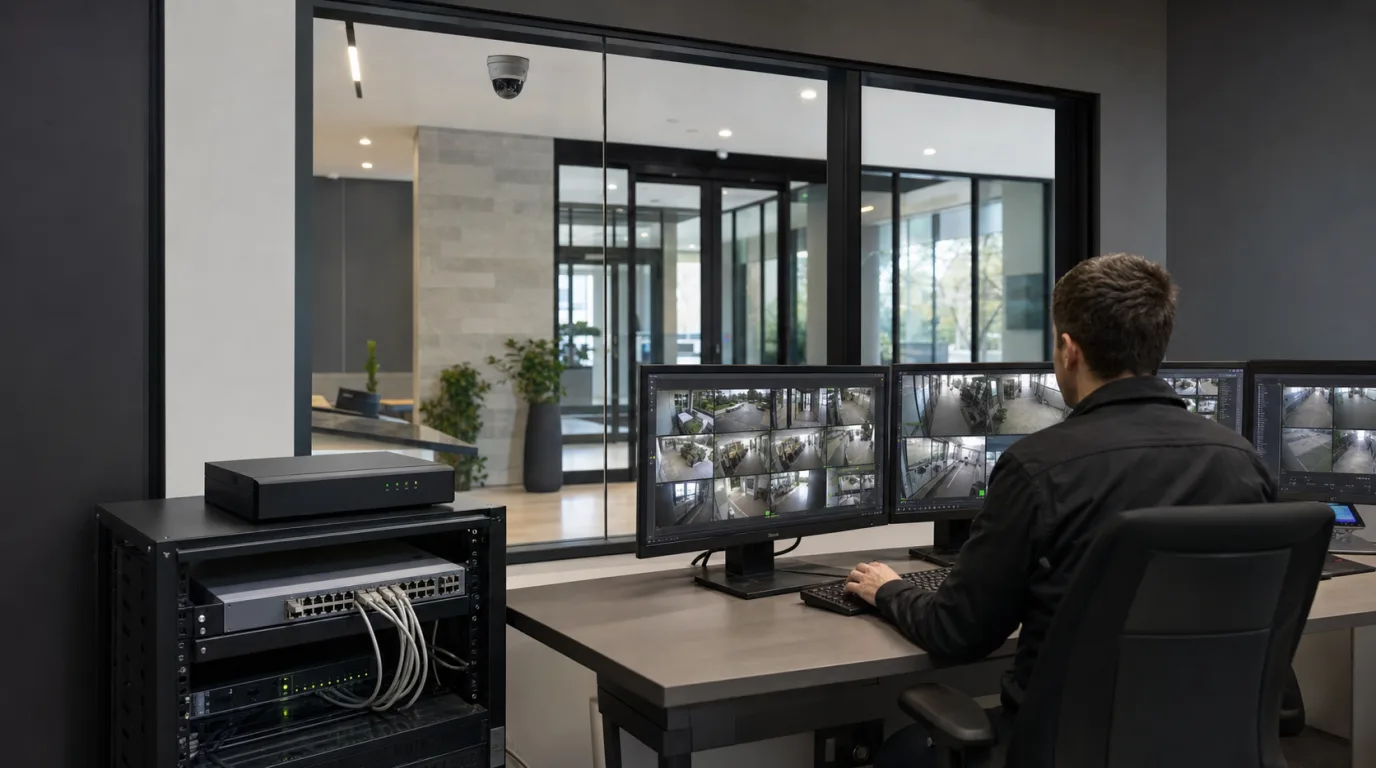
A central management recorder takes in video from cameras, DVRs, NVRs, and on-site servers, and handles live display, recording, and archiving in one place. For review, it provides time search, alarm search, and synchronized multi-channel playback.
Where the back end includes POS data search, a store that finds an irregular transaction can pull up the video from the checkout by transaction time. Chains with multiple stores can use group permissions and remote management, so that headquarters can review footage centrally.
Producing operational reports that combine the traffic data with POS remains an integration task: at deployment, each field in the store’s POS format is mapped to the corresponding zone and time window.